Inspirational Journeys - challenges and solutions for visual navigation of library resources
The workshop started with the head of the Medical Library, Helge Mjelde, giving a short introduction of the project before Hugo took over with his presentation of the work the visualization group has been doing the last ten months.
Presentation of the Visual Navigation Project
The Visual Navigation Project is essentially about enhancing library users' visual experience when searching for information, and inspiring them to take more advantage of the library’s resources. Hugo talked about the three main streams of the project:
- 1. Visual Navigation
- Creating new interfaces for visual book browsing and navigation, and using the infrastructure of the library's subject vocabularies.
- 2. Physical Interaction
- Explore novel interaction with library materials, e.g. via touch screen, touch table, etc.
- 3. Continuation and Extension
- Extend existing subject search infrastructure and interface, adding more vocabularies
He then went through five stages of our work, which sometimes overlap. These are: Rethink, Visualize, Connect, Evaluate and Document&Share
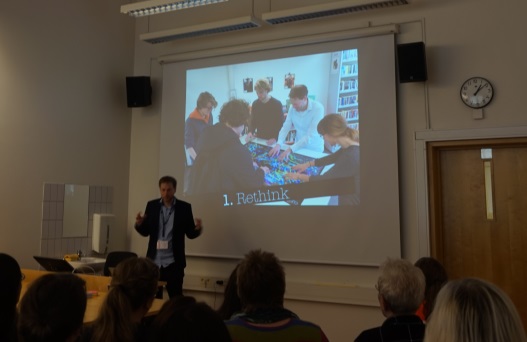
The rethink period was very fruitful, and consisted of amongst other thing observing commonalities & differences in the use of the library. We interviewed users, brainstormed and generally thought of ways to engage the user and to improve the user's experience. We wanted to stimulate curiosity and add the element of surprise.
When it came to the visualize period we learned more about the importance of data, and the suitability of data concerning certain visualizations. We worked on enriching existing catalog data with cover images and abstracts, utilizing subject vocabularies, and we saw the usefulness of existing frameworks. The contrast with existing library catalogs & systems made the need for testing novel tools apparent.
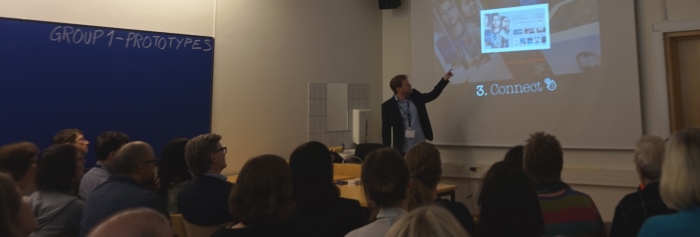
The connect phase was all about connecting library users with technology. We put our touch table in the Science Library and that presented us with new challenges and opportunities. We had many different reactions to the touch table, including “What is it?” “A touch table?”, or even “Is it a freezer?”. We also realized that people needed encouragement to interact with it, therefore we added a 'touch me' icon. We gained experience in touch app development, both concerning practical issues and understandability & usability. We created both Collection-focused and Event-focused applications.
After the touch table had been in use for a while, we could start to evaluate, correct and improve. This included monitoring and detecting issues, and redesigning based on usage data. We developed a “toolbox” for analytics and usage data, named microticks to gather data, and python scripts to automatically summarize data. We also learned that we have just one chance for a good impression, therefore we must optimize for first interaction and match user interests.
Throughout this whole project it has been important to document & share our findings on the project pages.
At the end of his presentation Hugo talked about what the next steps in this project will be, including the following points:
- Design and development
- Emnesøk (subject search)
- Personalization (RFID scanning)
- Lowering the barriers to application creation
- Dissemination
- Integration of tools in regular (online) infrastructure
- Check options for online publication of apps (rights, etc)
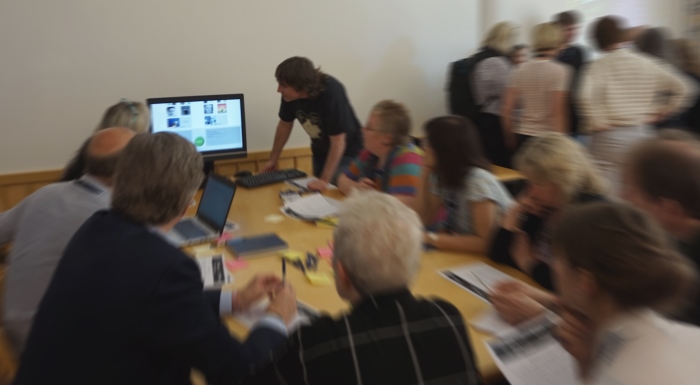
Exercises in breakout groups
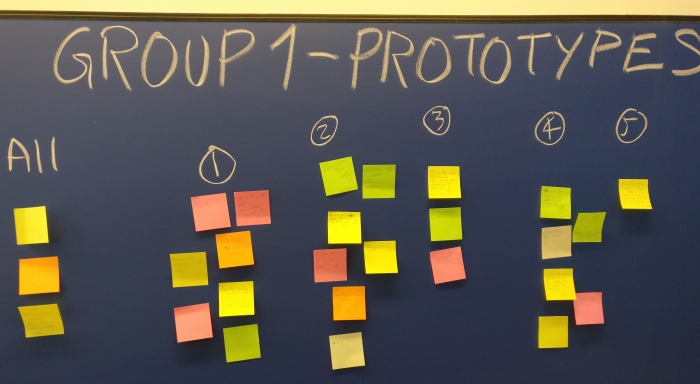
After Hugo's presentation the participants split into three groups, each centered around a workstation. The three workstations focused on different aspects of the visual navigation work that has been done this past year. The participants went through some exercises and were encouraged to write feedback on post-its that would go up on the blackboard.
- In the prototypes group, we briefly went through five types of visualization prototypes. Participants discussed positives and negatives and how they could be used at their institution. The five prototypes were Column charts, Network diagrams, Maps, Tag clouds, and Scatterplots, using a combination of Amazon and catalog metadata. Participants liked the interactive sorting features, as well as the possibilities to do non-linear exploration of topical networks of books. A variety of improvements was also suggested, including better color coding and color schemes, highlighting popular items based on catalog searches, and enlarging the size of on-screen items.
- The navigation group worked with the touch table application that explores the science fiction collection at the science library. They were asked to do 2 exercises and to discuss their opinions as they went along. The first exercise was to simply navigate the app and find positives and negatives. The application was deemed fun, innovative and to be revealing new parts of library collections. Some participants were confused as to what the connections were between the different elements (Topic, author/director and Book/Film/TV-series), but it was hard to find other practical solutions. The second exercise was to modify the data for the app in Google Spreadsheets, by adding a book. The feedback to this exercise was that it was exciting and enlightening how fast and easy a new element could be added to the app.
- At the events station the participants could explore two different touch table applications that were made for events at the Science Library, namely Hidden Figures and the Abel Prize. The participants found the applications to be quite relevant and inspiring, but also brought up ideas for what could be improved, including some navigation issues in the applications and e-book viewer. Several participants showed interest in a potential future workshop on making apps like these themselves, but were unsure if they would be able to allocate the necessary time. To justify spending time on such projects, it was suggested to create apps with more permanent content, or focus on recurring events (like the Abel Prize), or content that could be shared amongst several libraries.
After the exercises it was time for the second part of the workshop, which was called: "The Way Forward - Towards Novel Digital Library Services"
Visualization at NC State University Libraries
After the break we were very glad to welcome Mike Nutt, Director of visualization services, and Walt Gurley, Visualization and Digital Media Librarian at the North Carolina State University. They were there to talk about visualization at their library, and showed us how digital visualization is an integral part of their library’s design, both physically and functionally.
Mike started with telling us about their visualization services, and how they follow 5 steps to help the user to go from novice to expert:
- Get involved
- Learn
- Create
- Communicate
- Get help.
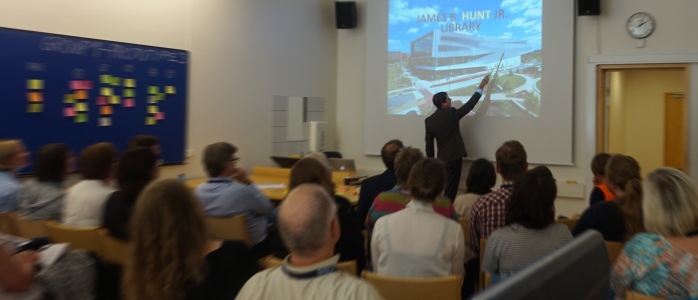
From there on he proceeded to talk about their library’s most exciting feature, namely their visualization spaces. Some of them serve as simply digital architecture, while others are more interactive and educational in their design. Here follows a shortened version of his presentation of the different walls and spaces:
- The Art Wall is one of the four public facing video walls in the James B. Hunt Library and features different art projects make by students and faculty.
- There is also the iPearl Immerson Theater, which is eye level, high resolution and functions as digital exhibit space with a playlist of content and a touch screen to select content.
- The Commons Wall is the main screen for the library’s academic content and is visible from several floors with a wide staircase that can accommodate large crowds.
- The fourth video wall is the Visualization Wall with panels of content that is made by both students and faculty.
The library also has four enclosed visualization rooms that have technology designed for research, collaborations and presentations:
- The game lab is there to support the university’s study of digital games, but is also a space for students to relax and play games
- The creativity studio can be configured in many different ways to accommodate different ways of teaching and learning. It is a high technology room with projectors, but also has moveable whiteboard-walls that are popular among the students.
- The teaching and visualization lab has ten projectors that allow you to create a 270-degree wrap-around environment.
- The visualization studio has twelve projectors that can show content from a single desktop, and is the newest visualization space in the library.
Even with all these high tech visualization spaces, Mike Nutt emphasizes that they always think about what's next.
Visualization Spaces & Events
Walt Gurley then takes over and talks about the different projects and events that take place in these visualization spaces.
One of the biggest event series at the James B. Hunt Library is The Coffee and Viz series, which is all about showcasing the visualization work of researchers. It features speakers from a wide range of fields, and the common thread is how they use visualization. Until now they have had 37 speakers over 27 events. They are open for everyone, and have drawn 1850 attendees of which 60 % are students. These events showcases both the technology and the library spaces, and support cross-departmental interaction.
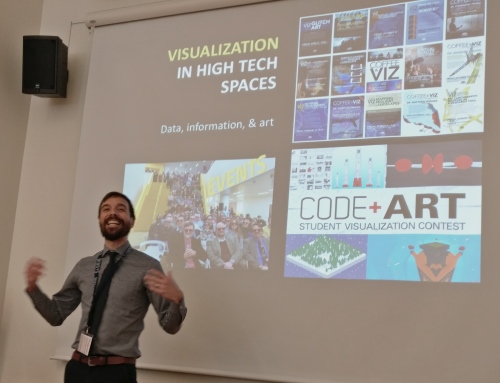
Walt also talked about Code+art, which is a student visualization contest that takes place yearly. It is meant to be a canvas for them to create. They submit interactive art pieces that are both powerful and aesthetically pleasing – which is the benchmark for visualization art. This event is beneficial both for the library and the winners, as the library gets great content and publicity and the winner gets a money price and a place to showcase their art.
Although we were left perhaps a little bit awestruck and jealous of the facilities at James B. Hunt Library, it was very inspiring to see what possibilities there are if a library truly embraces technology and visualization. Moreover, we were impressed by the exemplary cross-departmental interaction between the library, students and researchers.
This workshop was nominated for the VIRAK "NYSKAPENDE" prize for most innovative academic VIRAK contribution.
The workshop presentations can be viewed below:
Logg inn for å kommentere
Ikke UiO- eller Feide-bruker?
Opprett en WebID-bruker for å kommentere