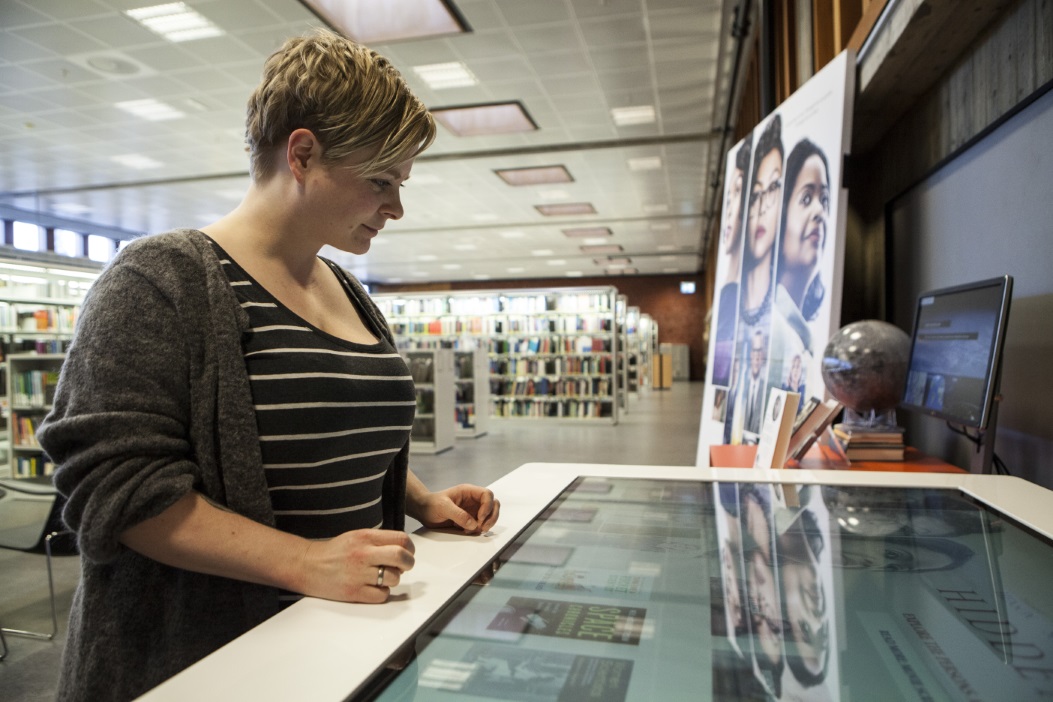
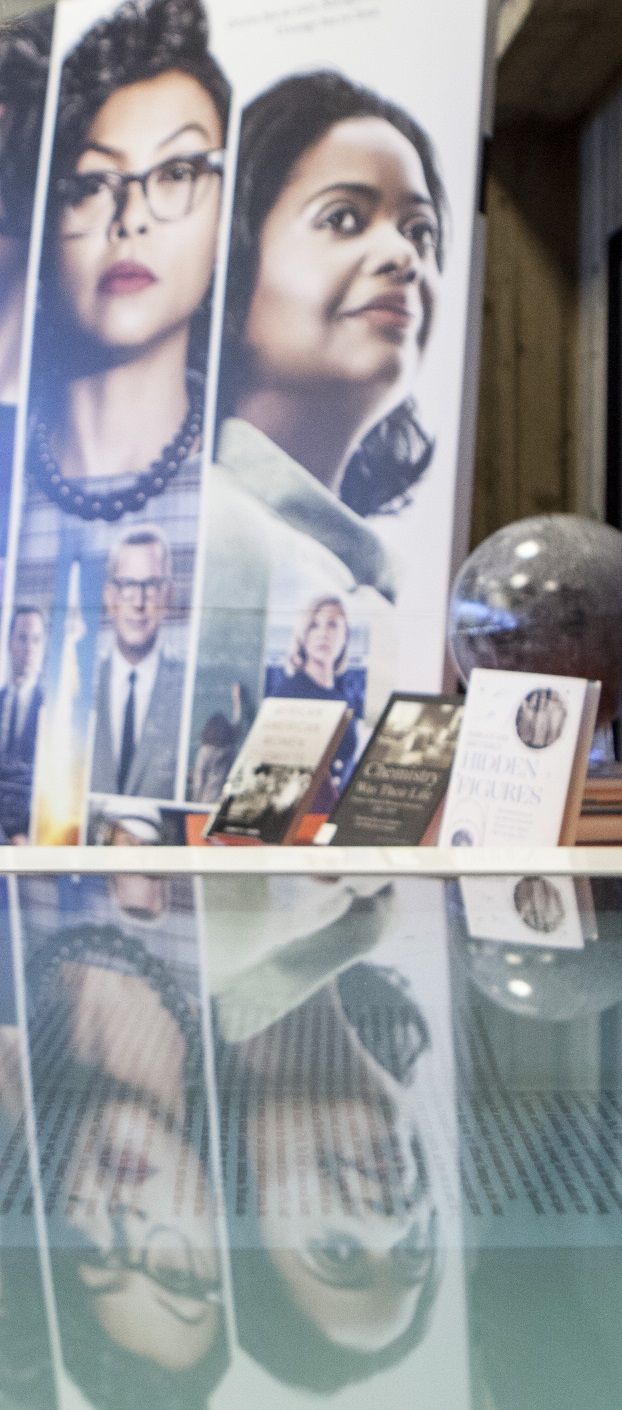
The “Hidden Figures” touch table application makes it possible to watch movie fragments, to explore contextual information about the film’s fictional and non-fictional characters, and to find & read related books (more information is available in this post). The application is of considerable size, as it contains 8 information screens, 9 movie fragments, 4 related YouTube videos, 6 representations of physical books, and 15 full-text e-books. All of this material can be accessed simply by touching the table, which was located close to the entrance of the reading room of the UiO Science Library.

In the first two weeks after its installation in the library, the touch application has already been used over 150 times. We observed that some people just passed by the table and tapped the screen once, while others engaged in serious interaction with the touch table. Also, some people looked at the table alone, and some together with others.
To reveal "hidden" interactions with the touch table, we analyzed gathered statistics with the touch table.
|
Data and Method: for our analysis, we used basic usage data from the first two weeks after installation of the touch table in the reading room of the Science Library (132 sessions). This anonymous statistics, in JSON format, contained timestamps, session identifiers, the previous and current page viewed by a user, and the x and y coordinates of user clicks. We processed (e.g. removing duplicate clicks) and visualized this data in Python, as well as Microsoft Excel. |
|---|
‘Hit & run’ versus ‘deep exploration’ - How did users engage with the application?
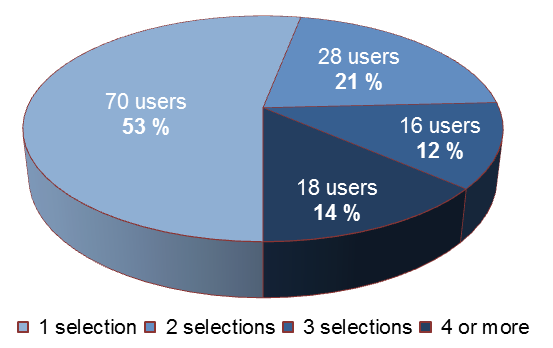
First of all, we looked at how 'deep' users explored the contents offered by the touch table application, since this gives us insights into the required depth of potential touch table applications. Based on the captured statistics, Figure 2 shows that 70 users (53%) only selected one video, book or movie information page. 62 users (47%), on the other hand, engaged more actively with the table. The 18 most interested users (14%) explored between 4 and 14 screens of the application.
Our next question was which of the screens and items contained in the touch table application were most popular. The single most popular item was an e-book, “Seven Secrets Of How To Think Like A Rocket Scientist” (opened 49 times), followed by the trailer of the Hidden Figures movie (42 times), and a character information page about the fictional characters in the movie (36 times).
Hence, we observe different interaction styles: just quickly trying out the touch table application versus deeply exploring the application's content. Moreover, some of the homescreen items are commonly opened by users.
Books, Movies & Info - Which types of information were predominantly explored?
The application contained three main types of content: books, movie fragments and information pages.
Somewhat surprisingly, the largest degree of user interactions was with the books contained in the application, which were opened 128 times (42%). This was followed by the movie fragments in the application (89 times or 29.2%) and the movie information pages (88 times or 29.2%). Hence, despite the potential attraction of moving images, represented by animated buttons in the homescreen, these were actually less popular than the included books.
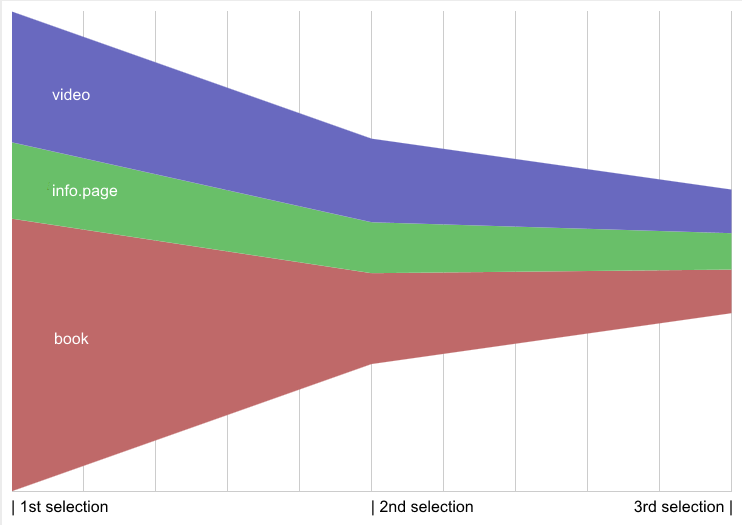
To get more evidence of the importance of different kinds of materials, we looked at the order in which users chose different features of the application.
Figure 3 reveals the degree of focus of users on books, videos and information pages. Users' initial selections (i.e. tapping on an item on the touch screen) were mainly focused on books, while subsequent interactions were more equally spread between books, videos and information pages. This supports the observation that user interactions with the touch table application are often focused on books.
“Should I Stay or Should I Go” - How much time do people spend on a screen?
Just selecting a book within the application does not necessarily mean engagement with the book materials, since it is possible that a user only briefly looks at a book in the application. This urged us to analyze how much time users spend on a single screen.
In Table 1 we can observe that people spend the most time on average within the e-books, with an average of 30 seconds, which is closely followed by the video fragments. Comparatively, people spent less time in the physical book representations (showing just a cover and a message that the book could be found in the exhibition), and the least time in the information pages about the movie and its characters.
| Material type | Average time spent (seconds) |
| e-book | 30 |
| video fragment | 28 |
| home screen | 10 |
| physical book representation | 9,5 |
| information page (character / movie) | 6,75 |
The book which users comparatively spent most time reading is the e-book "Stability and Chaos In Selestial Mechanics", with an average time of 34 seconds. This is followed by the "behind the scenes" video about the music in the Hidden Figures movie (30 seconds).
“Heatmaps”: Which regions of the screen do users touch?
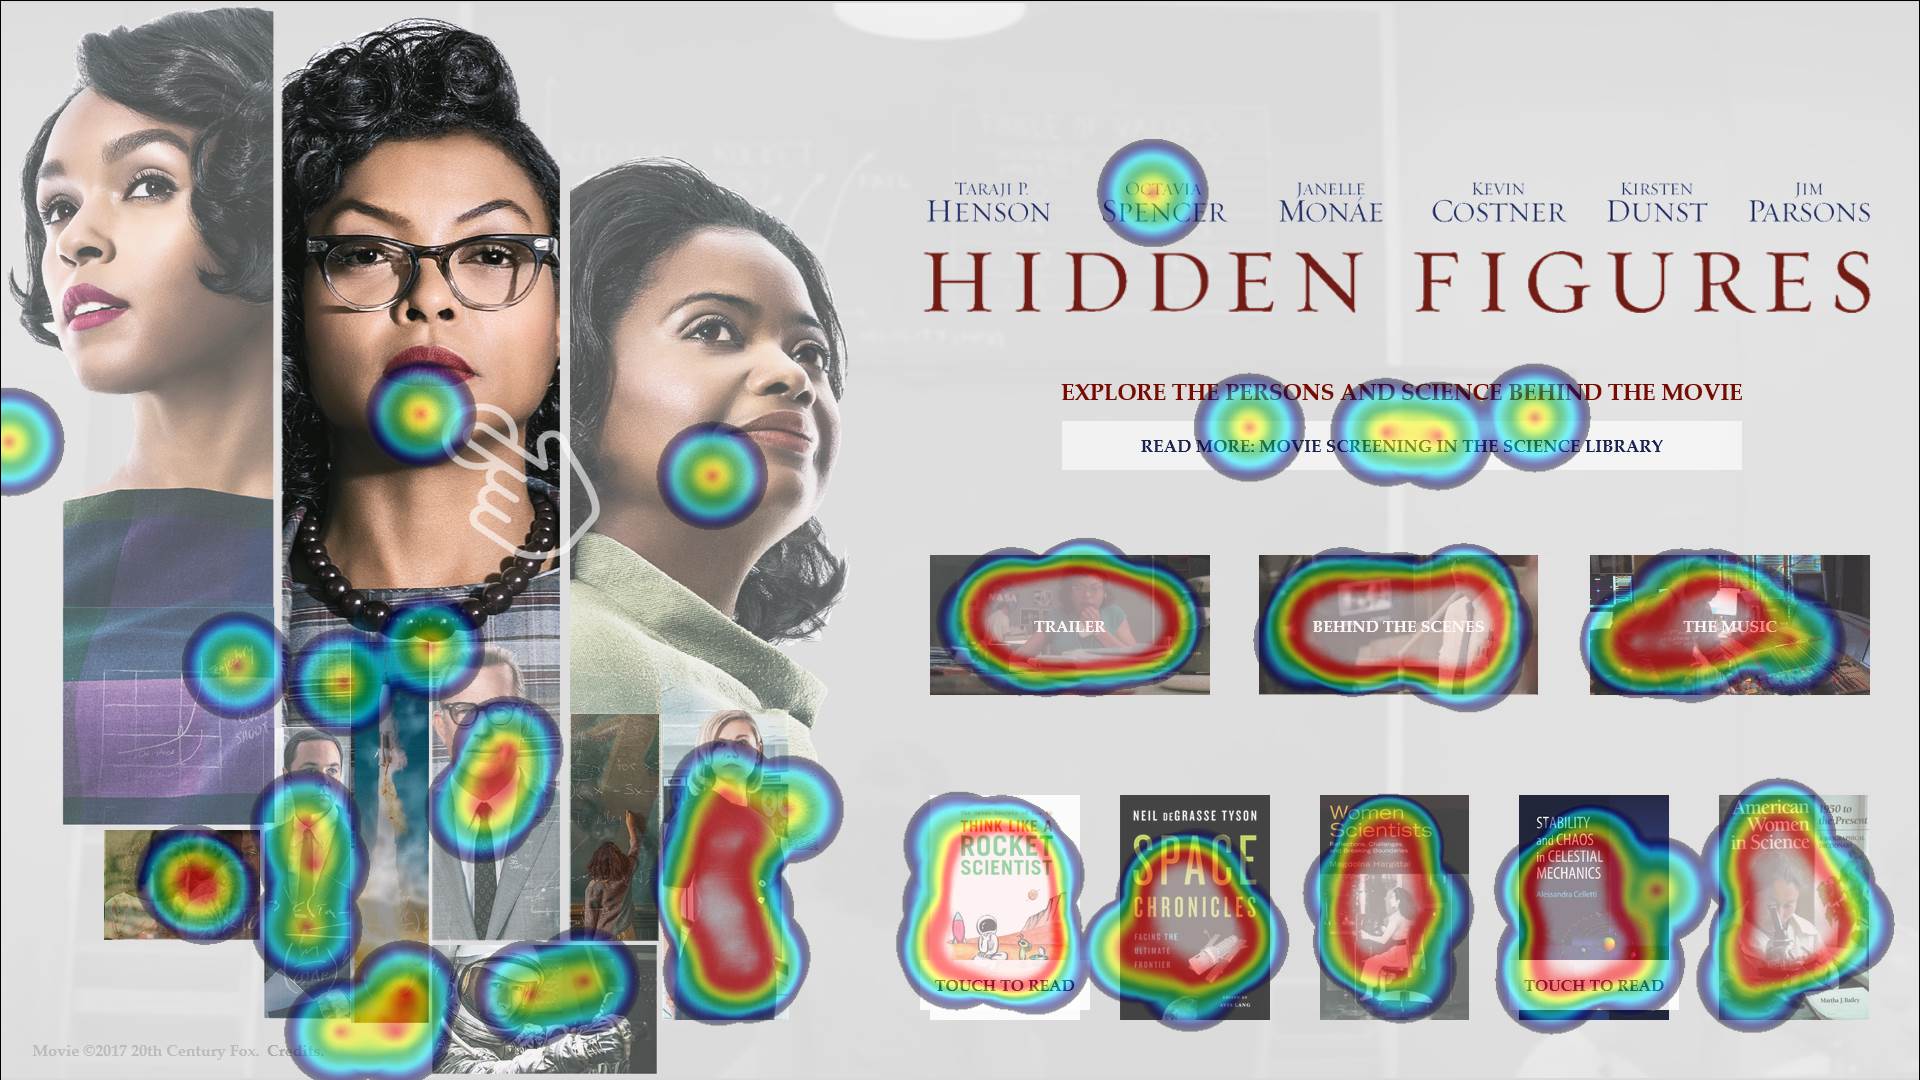
To get more visual overviews of user actions in the application, we created so-called heatmaps of user interactions. These heatmaps show where users try to click in the application (see Figure 4).
The heatmaps can also help to improve our application. For instance, we could observe that some users tried to tap screen areas where no buttons were defined. Also, we showed some of the physical books in the exhibition as icons the home screen, along with e-books. However, we found that the division between physical and e-books was not clear to users. Some users tried to "swipe" to read the physical books, even though these only consisted of a single static screen. Therefore, after analyzing the data, we corrected our application and subsequently showed only e-books on the homescreen.
“Work ‘n Relax”: When was the touch table most used?
Another potentially interesting aspect of the touch table use is when such a device is used most. We would e.g. expect users to try out the touch table when stumbling upon it in the library, but perhaps also when seeking diversion or distraction during a day of studying.
A quick look at touch table usage per day of the week (within the first two weeks) shows an expected distinction between weekdays and weekend, with a clear drop in use of the touch table. During the initial two-week period, we can observe that the touch table was most used on the Thursdays.
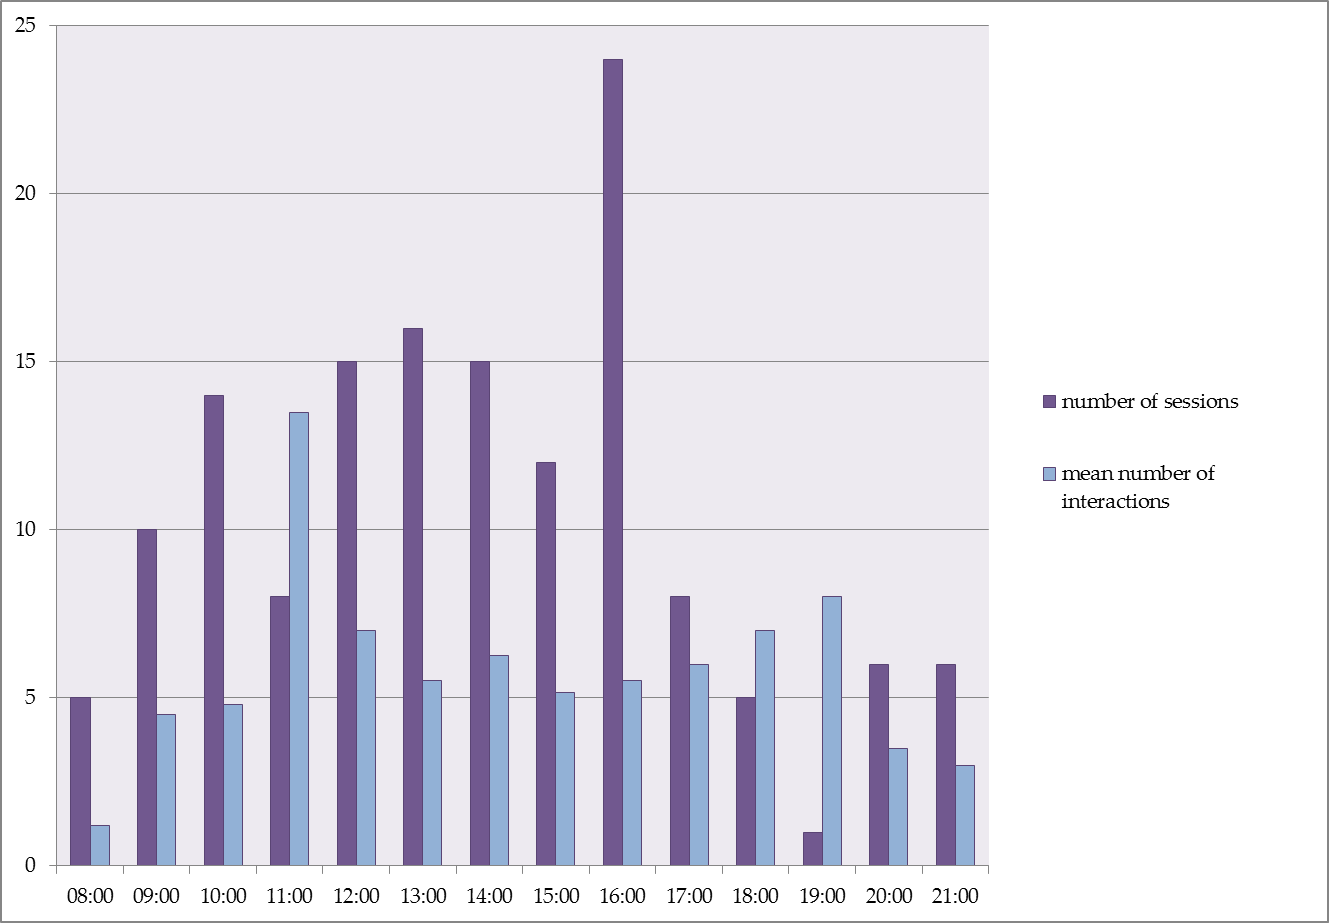
To get more insights, we also looked at the use of the touch table during each day. Figure 5 shows the number of sessions per hour of the day (in purple). As expected, the number of sessions per hour of the day shows a gradual increase in the beginning of the day, and some decrease at the end of the day. However, we see a clear “spike” around four o’clock. This may be caused by more people passing the touch table at that time (or perhaps an increased need for diversion at that time).
In blue, the graph also shows the mean number of in interactions per session. Conversely to the number of sessions, the mean number of interactions (i.e. the depth of exploration) is highest around 11 in the morning. In the coming time, we will further investigate these findings.
Learned Lessons
Even though the analysis described in this post only used basic statistical data, we can derive a number of valuable lessions with respect to the use of a touch table application in a physical library space.
 1. Clear popularity
First of all, we observed that quite a substantial number of library users engaged with interaction with the touch table: over 150 in the first two weeks. This implies that a touch table may be a worthwhile addition to the physical library space, and that users are not afraid to try it out.
2. 'One chance for a first impression'
Secondly, we observed that half of the users only explored a single page of the touch table application. This means that it is important to optimize the user experience at this first moment. Furthermore, it suggests that these types of applications do not necessarily have to be very “deep”. Our application contained 8 different information screens and a variety of related materials, but the majority of interactions took place with the items directly accessible via the home screen.
3. The value of monitoring logging and statistics
Third, it is important to keep monitoring the use of digital applications in a library space. For instance, user frustrations may arise. Even though we performed thorough usability testing of our application before releasing it, we still found issues via the usage logs which helped us to improve the application. Some of these issues we could not even have picked up via the testing before release.
4. User engagement with books
Our final learned lesson is that, despite some expectations, users actually engaged with the e-books available in the application; to a higher extent than with the video fragments and movie information. This suggests that users may be interested in exploring books via a touch table, which we will further test out in future projects.
What's next?
In the coming weeks, we will further monitor the use of the “Hidden Figures” touch table application. We had positive experiences with the rapid prototyping approach used in this project (using an existing framework), and plan to apply this again in future projects, both for short-term exhibitions and as a way to provide access to more long-term exploration services. In sum, the experiences gained in this touch table project are very useful as a basis for further prototyping and development, in the Visual Navigation Project and beyond.
Logg inn for å kommentere
Ikke UiO- eller Feide-bruker?
Opprett en WebID-bruker for å kommentere