Summary
The first week of the New Year included explorations into visualizing our book datasets. Using merged catalog records, we looked at which visualization methods work effectively with this kind of data. Furthermore, various meetings took place, focusing on sharing knowledge between projects and the organization of a workshop.
Specific activities
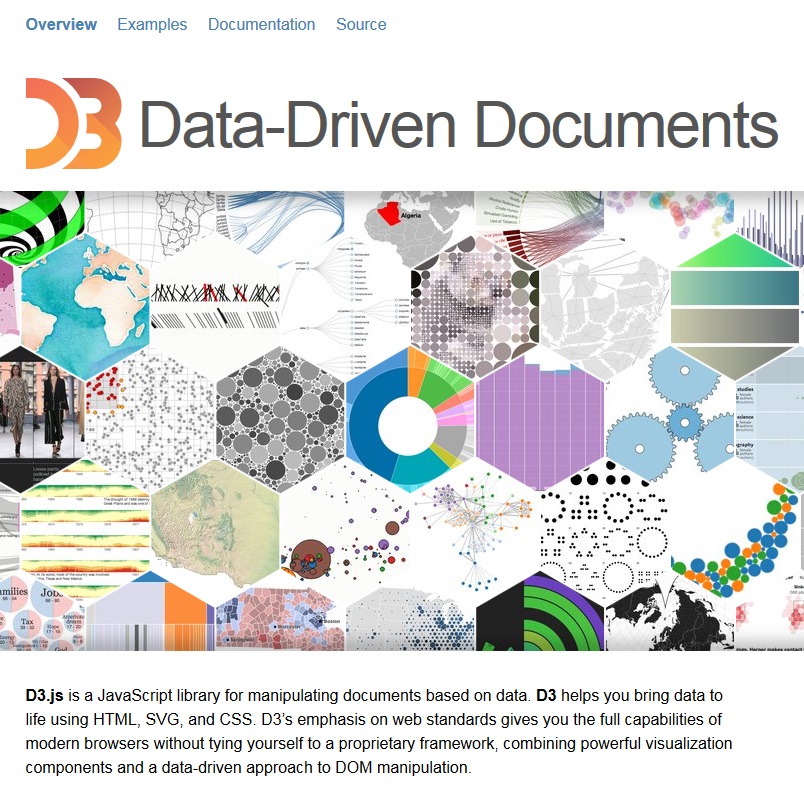
Initial experiments using d3 (“Data-Driven Documents) to visualize book records from the UiO catalog and Amazon. The first steps involved extracting a subset from a created set of almost 300.000 merged records, and to process them to work with them in d3. Secondly, it involved learning about the workings of d3. An initial rudimentary visualization of 5,000 books, based on their Amazon ratings, titles, descriptions and DDC classifications was created; this work will be continued in the next week.