Summary:
These two weeks, work in the project involved the writing of a full journal paper for the VIRAK conference, and the “visual navigation” prototypes were developed further.
Specific meetings, including:
- Presentation of project and visual navigation demos to HiOA LIS students (Dan Michael, Kyrre).
Specific activities, including:
- Work on NORIL paper (Nordic Journal of Information Literacy in Higher Education), based on our VIRAK presentation (Hugo, Mikaela, Dan Michael)
- Literature review
- Find out how to customize Oria “ranking” of results
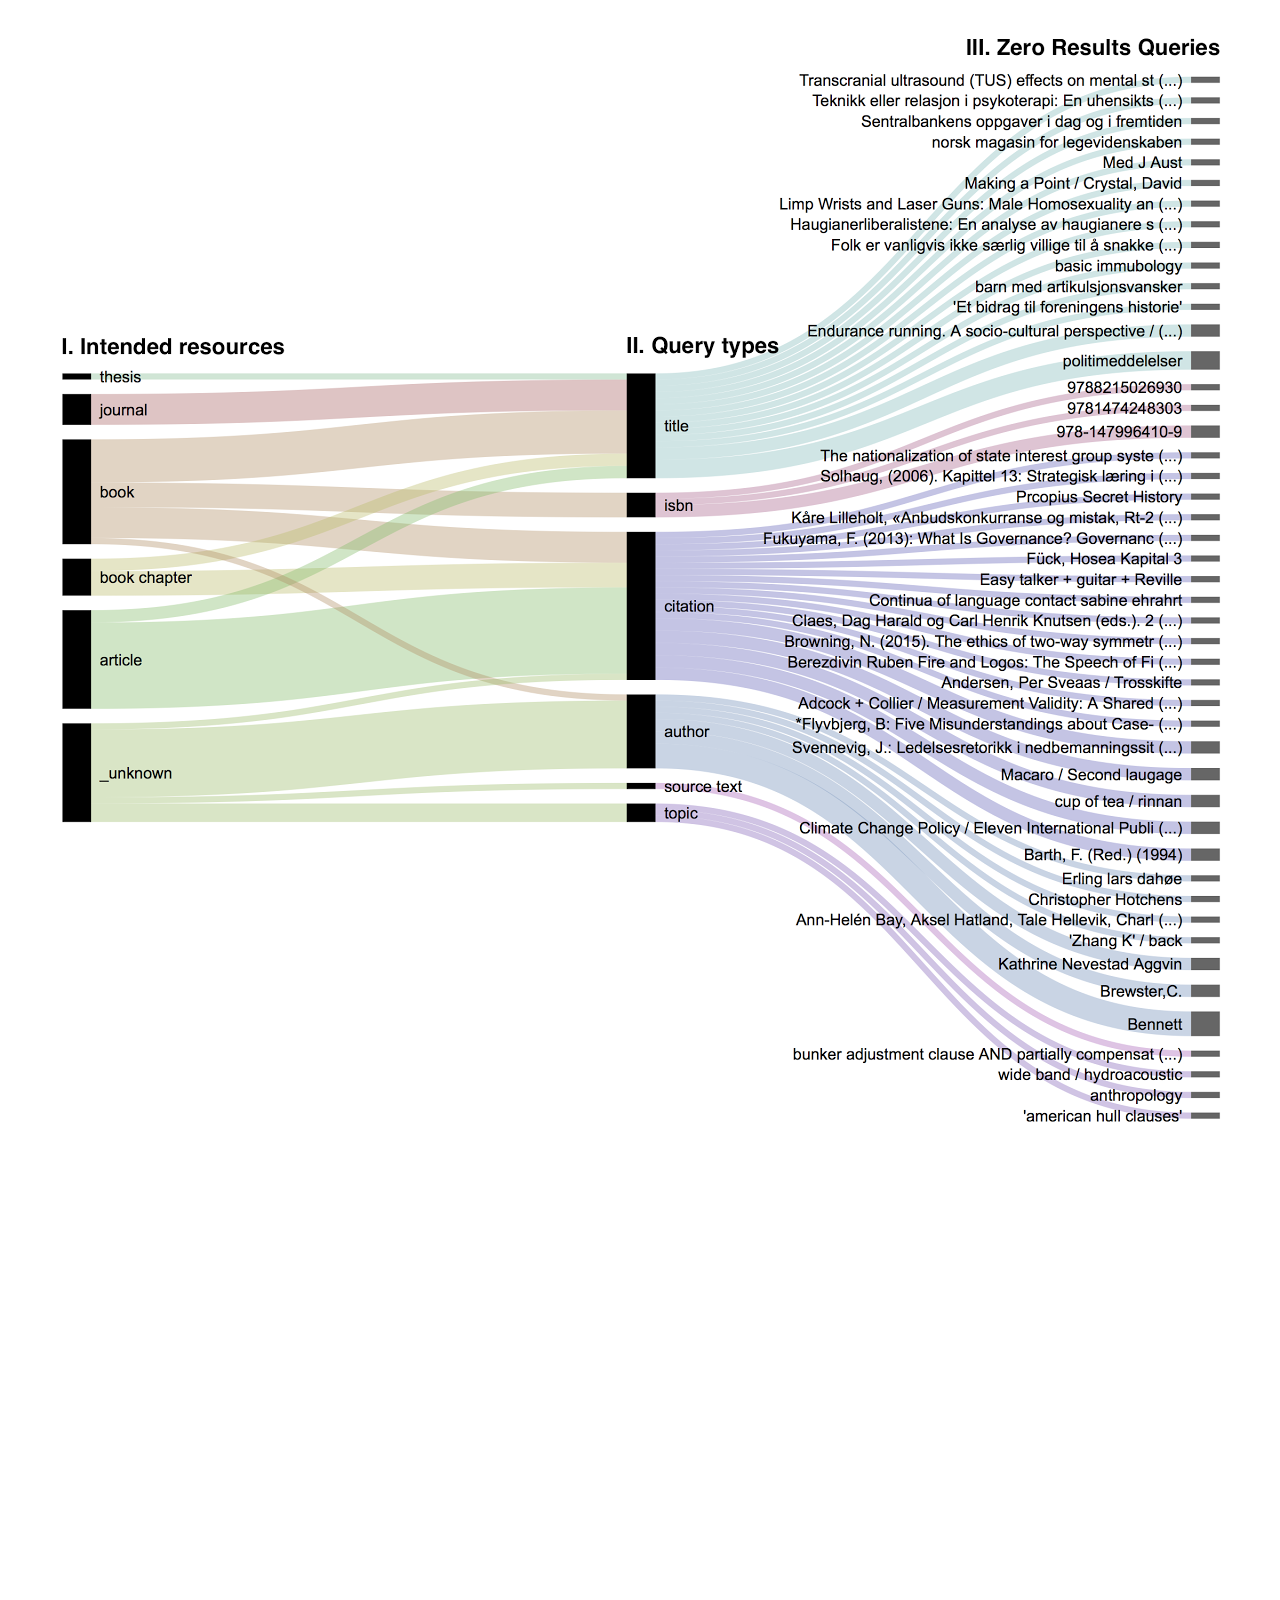
- Visualize findings in new ways using RAW Graphs , see figures below
- Further work on collection explorer interface (Hugo, Dan Michael)
- Integrate library maps, check how to integrate other ways of getting a book reference ( sms / bibcraft example )
- Check how to obtain realtime availability of books
- Create “Like” button
- Make it work with more different collections