Reports and Papers
This page summarizes the papers and reports written during the Visual Navigation Project.
1. Academic Papers
The following academic papers were published by support of the Visual Navigation Project:
1.1 Project-related papers
“More than Meets the Eye” - Analyzing the Success of User Queries in Oria (Journal paper)
|
|
|
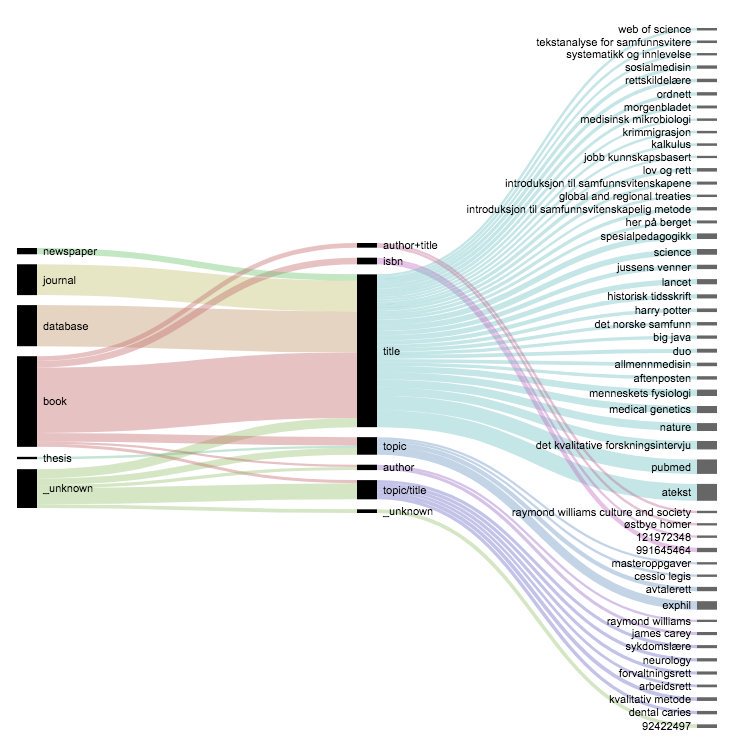
For the NORIL journal, we used a transaction log analysis approach, using popular and zero result queries datasets gathered from the statistics module of a library discovery system. The paper explores what types of queries users perform, how successful the queries are, and examines underlying reasons for unsuccessful queries. |
|
|
The Collection in a New Light – Towards Visual Exploration and Navigation of Academic Library Resources (Journal paper)
|
 |
For a library-related journal, we created a paper summarizing the experiences in the Visual Navigation Project with regards to visual exploration and navigation. |
|
|
1.2 Other papers
- Hugo C. Huurdeman (2017). Dynamic Compositions: Recombining Search User Interface Features for Supporting Complex Work Tasks. Proceedings CHIIR 2017 Second Workshop on Supporting Complex Search Tasks (SCST 2017), p. 21-24, Oslo, Norway, March 2017.
- Hugo C. Huurdeman, Jaap Kamps (2017). A Collaborative Approach to Research Data Management in a Web Archive Context. In Research Data Management – A European Perspective. Berlin, Boston: De Gruyter Saur.
- Liliana M. Melgar, Marijn Koolen, Hugo C. Huurdeman and Jaap Blom (2017). A process model of time-based media annotation in a scholarly context. Proceedings of the 2017 Conference on Conference Human Information Interaction and Retrieval (CHIIR 2017), p. 305-308, Oslo, Norway, March 2017. ACM.
2. Reports
2.1 Reports of workshops organized by the Visual Navigation Project
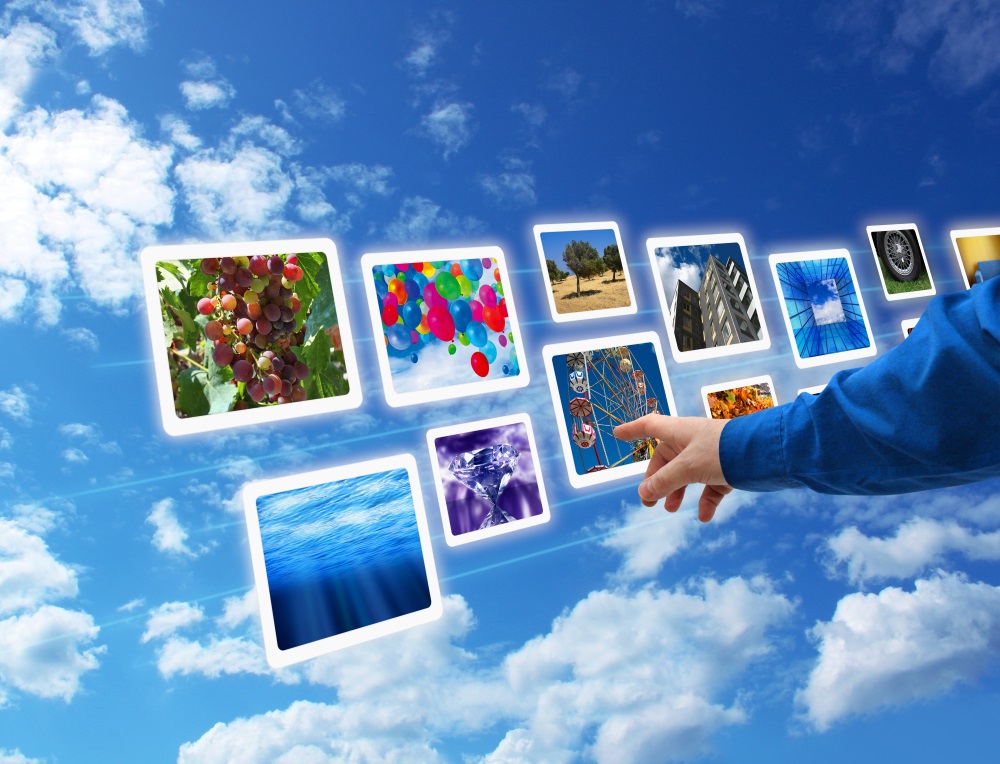
Engaging the User – Creating Touch Applications for Libraries using XIMPEL
|
 |
How to create touch screen applications to entice & engage library visitors? This was the premise of a workshop organized by the Visual Navigation Project on 20 November 2017. In the workshop, participants gained experience with building touch applications using the XIMPEL framework. |
|
|
Inspirational Journeys – Visual Navigation of Library Resources
|
 |
On 13 June 2017, the first day of the VIRAK conference, the Visual Navigation Group hosted a workshop called "Inspirational Journeys – challenges and solutions for visual navigation of library resources". The objective of this workshop was to foster interactive discussions about how users can explore and interact with library materials. |
|
|
2.2 Reports of explorative studies conducted by the Visual Navigation Project
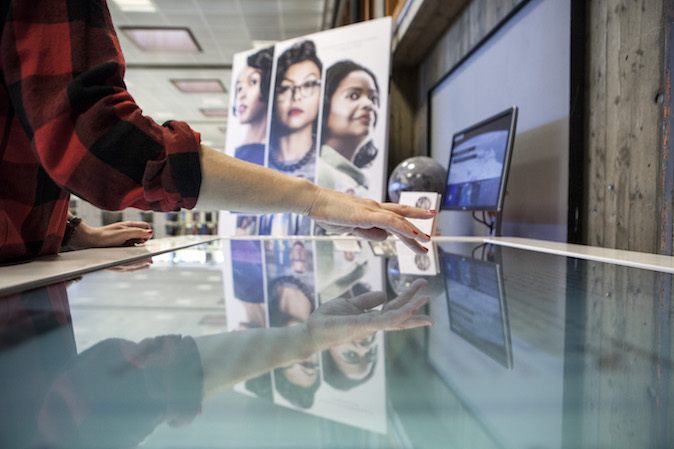
Invisible Interactions: Studying In-Library Usage of a Movie-Related Touch Table Application
|
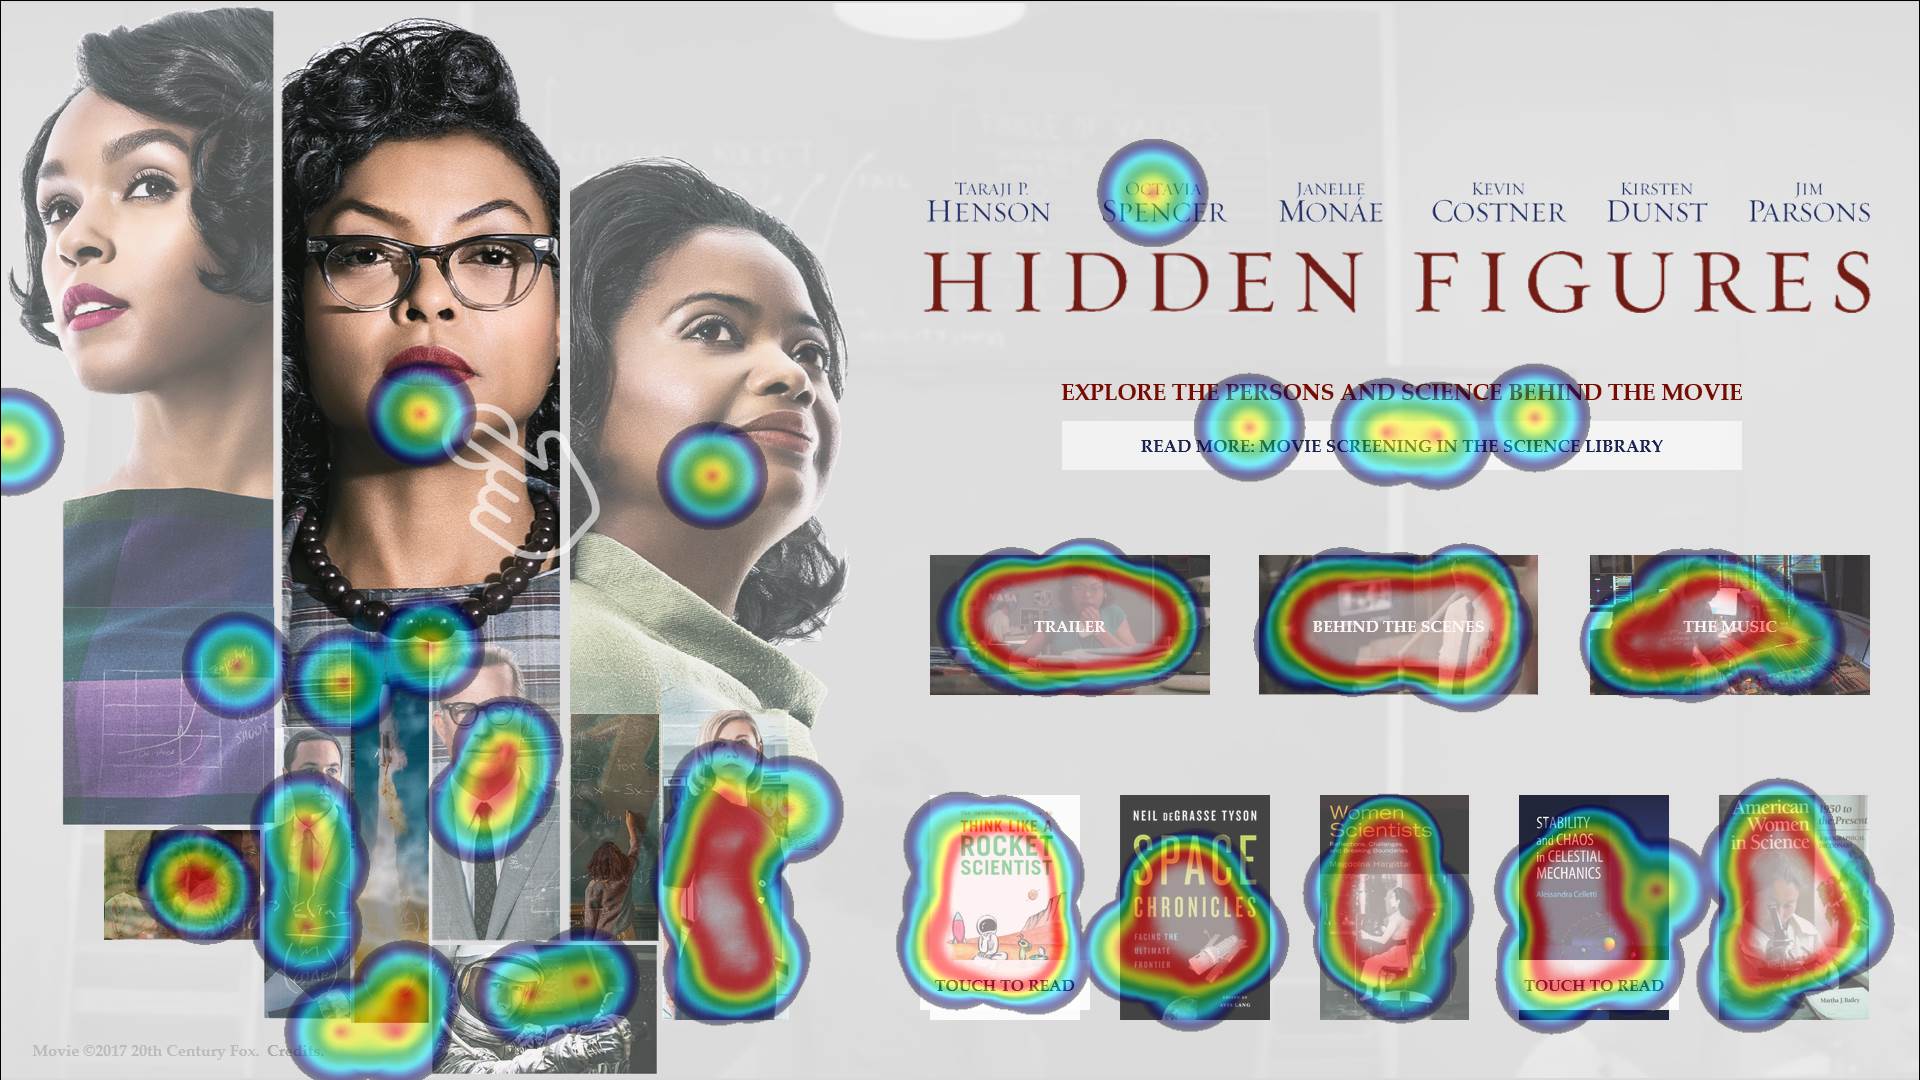 |
On the 8th of March 2017, an exclusive pre-screening of the movie “Hidden Figures” took place in the Science Library. To obtain insights into the actual use of this application, we gathered basic statistics. This post summarizes our findings, based on the first two weeks in which the touch table was installed in the library.
|
|
|
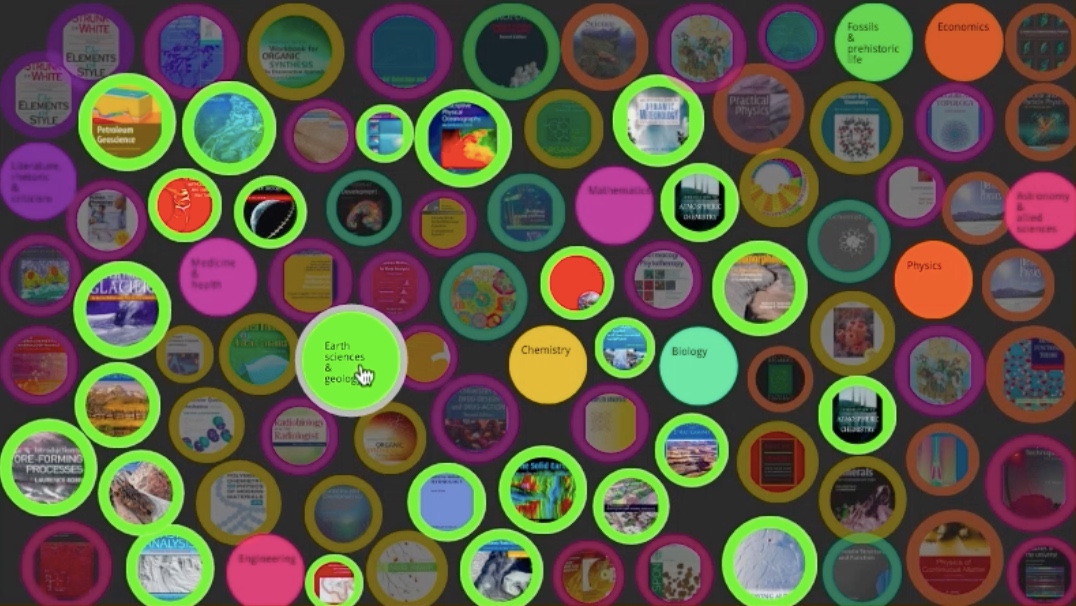
From Records to Visuals: Visualizing Book Metadata
|
 |
Evidently, visualizing books is a pivotal goal of the Visual Navigation Project. In the last weeks of December 2016, we created an initial infrastructure for enriched book data. This post summarizes explorations to visualize book records of the University of Oslo Library. |
|
|
Not Available, or Not Found? Lessons from User Queries in Oria at UiO
|
 |
In an exploratory study within the Visual Navigation Project, we have analyzed the log data available of the library catalog of the University of Oslo. This work was later presented at the VIRAK conference and extended to a journal paper (see above). |
|
|
Publisert 9. mai 2018 12:26
- Sist endret 16. jan. 2019 22:42